Back to: General X-ray eLearning
The most fundamental aspect of radiographic imaging is evaluating for image quality.
In this post, I will discuss two similar but unique characteristics of any radiographic image – the image contrast and image density.
Summary
- image density – primarily controlled by mAs
- image contrast – primarily controlled by kVp
- always use every single digital manipulation technique available on the imaging software to alter the histogram before the repeating the x-ray exposure. This may avoid a repeat exposure – ALARA!
- low mAs = underexposure = whiter appearance = more quantum mottle
- high mAs = overexposure = darker appearance = skin edges usually burn out first
- low kVp = high contrast technique
- high kVp = low contrast technique
Before repeating an exposure
For all that is ALARA, please make sure you try every digital manipulation technique available on the imaging system before repeating an examination! You might be able to alter the appearance of the image histogram and avoid a repeat exposure.
If in doubt – just think of me standing there judging you heavily before pressing the expose button. Check your exposure factors first!
It’s not all the same!
While on clinical placement, the x-ray exposure factors that you use will differ from the ones taught at university because every x-ray system is different. Since the mAs is merely a reflection of the total tube output at the tungsten target, you won’t need as much radiation to achieve the same image quality on newer x-ray systems because newer systems simply process radiographs better. Think of cars, you would expect newer cars to be more fuel efficient – that is, less petrol per kilometer. This is the same for x-rays, less radiation is required to produce the same image quality.
It is extremely important that you learn the standard mAs chart for each x-ray room that you work in because the final image is affected by the filtration and processing power of the x-ray system. Newer imaging systems have better image processing power and will require less radiation for the same examination compared to older systems.
Every digital system will have some mechanism to quantify the amount of radiation used and the overall image quality. Some companies call this the exposure index (EI). Although the EI is a good indicator of image quality and the exposure settings, it is influenced by incorrect ROI positioning. Therefore, learn your exposure factors and position the ROI in the correct FOV in the centre of your digital detector.
First, we will review important radiographic physics terms.
X-ray interaction with matter
No interaction (complete transmission): X-ray passes completely through the tissue and captured on the image receptor.Complete absorption: X-ray is completely absorbed by the tissue, altering the amount of transmitted photons reaching the detector.Partial absorption with scatter: There is a partial transfer of energy to the tissue.
X-ray attenuation is the reduction in intensity of the incident x-ray beam as it traverses through the body. Therefore, x-ray attenuation is a mixture of complete transmission, partial and complete absorption.
In the diagnostic range, 40-120 keV, complete absorption and partial absorption is by far the most common interaction. Complete transmission is far more dominate in the therapeutic range and in the high diagnostic range. It is well established that the photoelectric effect is the dominate interaction in the low kV range while the Compton effect is dominate in the mid to high diagnostic kV range.
So what happens?
- X-rays photons either transmit through the patient and reach the detector
- The photons ionise via the photoelectric effect and are completely absorbed by an electron
- The photons are scattered via the Compton effect and generate a lower energy scattered photon and a photoelectron. Both the photoelectron and scattered photon continue to ionise other electrons until the last generation is fully absorbed via the photoelectric effect.
The large amount of random interactions during the compton effect produces a large quantity of low level x-rays that degrade image quality (noise).
X-ray quantity
X-ray quantity refers to the amount of x-rays produced during the exposure. X-ray quantity is directly proportional to the product of tube current (mA) and radiation exposure time (s), expressed as milliamphere-seconds (mAs). Put simply, the mAs value that you select is the quantity of x-rays that will be produced at the x-ray anode target before any filtration. In clinical practice, this value represents the desired quantity of x-ray needed for the examination.
In practice, low energy photons only add noise artefact to the image and are removed via additional filtration. This has the added benefit of reducing the amount of radiation dose to the patient.
The primary controlling factor of x-ray quantity is the mAs value but the exact quantity of x-rays produced is multifactorial. Other notable factors include:
- the peak voltage (kVp)
- X-ray quantity production is approximately proportionate to the square of tube voltage.
- distance from the source (inverse square law)
- The quantity of x-rays is inversely proportional to the distance from the source.
- E.g. A hand x-ray performed at 100cm FFD/SID on average receives more x-ray photons than a hand x-ray performed at 150cm FFD/SID. Therefore, you need to increase the exposure used at 150cm to maintain the same x-ray quantity.
- beam filtration
- Increasing the amount of beam filtration reduces the amount of x-ray quantity (from the removal of low energy photons).
There are more practical quantities to measure that amount of radiation exposure to the patient that you will come across in your physics lessons at University and maybe a future blog post here. A popular quantity that you will come across in fluoroscopy is the air kerma. The word kerma is actually an acronym (similar to the word ‘laser’), it stands for ‘Kinetic Energy Released per unit MAss’ and represents the radiation exposure deposited on the air just above the skin surface. Therefore the SI unit for air kerma is J/kg and given the radiation unit Gray (Gy).
X-ray quality
The quality of the x-ray beam plays a large part in maintaining image homogeneity. In clinical practice, the quality of the beam refers to the penetrating power of the x-ray beam or the effective photon energy. I recall that the effective photon energy is somewhere between 30-50% of the maximum tube potential (kV). Therefore, the maximum tube potential plays a large part in beam quality.
From your physics classes, you may recall that the half-value layer (HVL) is a measurement of the amount of material required to reduce your x-ray beam by 50%. For example, at 80 kVp about 3mm of aluminum is required to reduce your x-ray beam by 50%. An increase in maximum beam energy increases the effective tube potential and also increases the amount of material required to reduce your x-ray beam by 50% (HVL value increases).
If mAs is the primary controlling factor of quantity then kV is the primary controlling factor of quality. Although the degree of x-ray quality is multifactorial, in reality, the only other notable factor that affects quality is pre-collimator beam filtration. Increasing the amount of filtration improves the quality of the x-ray beam (beam hardening).
In practice, selecting a higher tube voltage on the x-ray console further excites the electrons at the cathode; producing many more x-ray photons and results in an x-ray beam with a higher average peak voltage. Adding pre-collimator filtration hardens the x-ray beam and removes low-energy x-rays but reduces the x-ray quantity. This is seen in the spectrum below.
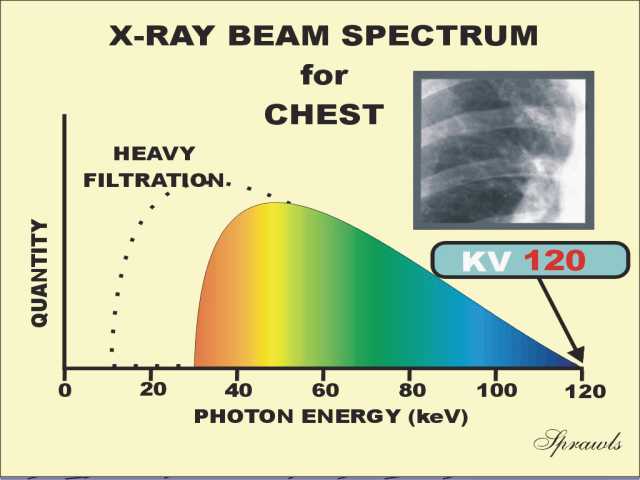
The image above demonstrates a hypothetical selection of 120 kV for our standard PA chest. The spectrum has two important interpretations.
- The peak kV is about the 30-35 keV prior to filtration
- Pre-collimator filtration (heavily filtration in this example) hardens our x-ray beam, removing the low level energy photons (that would have just contributed to dose) and made our effective photon energy about 45-50 keV.
Increasing quantity vs increasing quality
Increasing the mAs and maintaining a constant kV – proportionately increases the number of x-rays produced – there is no change in the average photon energy
Increasing the kV and maintaining a constant mAs – average photon energy increases – many more photons are produced from the larger electron excitement.
What you came here for…
Radiographic density
In conventional screen-film radiography, the radiographic density is a reflection of the amount of photons reaching the image plate. The more photons that reach the image plate the darker the image. Thus, some radiographers also use the term transmitted density.
In the digital world, radiographic density is still a reflection of how many photons reach the image detector but with the power of computation, we are able to manipulate the overall histogram*.
*A histogram is the graphic representation of the total pixel intensity counts that are present on an image. This is the same as any digital photograph, not exclusive to radiography.
An increase in either mA or exposure time increases the x-ray quantity and consequently the amount of x-ray available for interaction increases linearly.
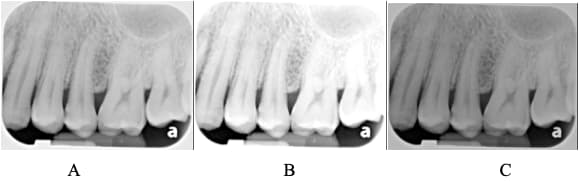
The image above demonstrates the affect of mAs on image density. (A) is the reference image. (B) demonstrates a decrease in mAs and as a result less photons reach the detector resulting in an underexposed image when compared to (A). (C) demonstrates an increase in mAs and demonstrates an overexposed appearance when compared to (A). Also note how the overall radiographic contrast doesn’t change. We can still see all the fine detail that we saw in image (A).
In a radiographic image critique, I would often suggest that students use the terms “under-exposed’, ‘adequately-exposed’ or ‘over-exposed’ when referring to radiographic density. When using these terms, the student will need to justify their response. See my image critique examples in other posts. E.g. Ankle Critique
Increases in mAs will begin to burn out the lateral skin margins first and this is followed by other less dense structures. Unique to chest x-rays, the lungs often show signs of burn out first followed by the lateral skin margins. This is described as over-exposure and the images become darker. Remember that in radiography, a darker image represents a larger concentration of photons reaching the image detector. This is the opposite of digital photography where a bright white area often represents too many light photons reaching the digital sensor.
When a low mAs value is selected, the image is under-exposed with a bright/white appearance and the lateral skin margins are well demarcated. Low mAs values also introduce quantum mottle into the mix. Quantum mottle is the inherent uncertainty in our radiographs due to an insufficient number of photons reaching the detector causing image noise/a grainy image. Large structures may be visible but an underexposed image always lack low-contrast and spatial resolution.
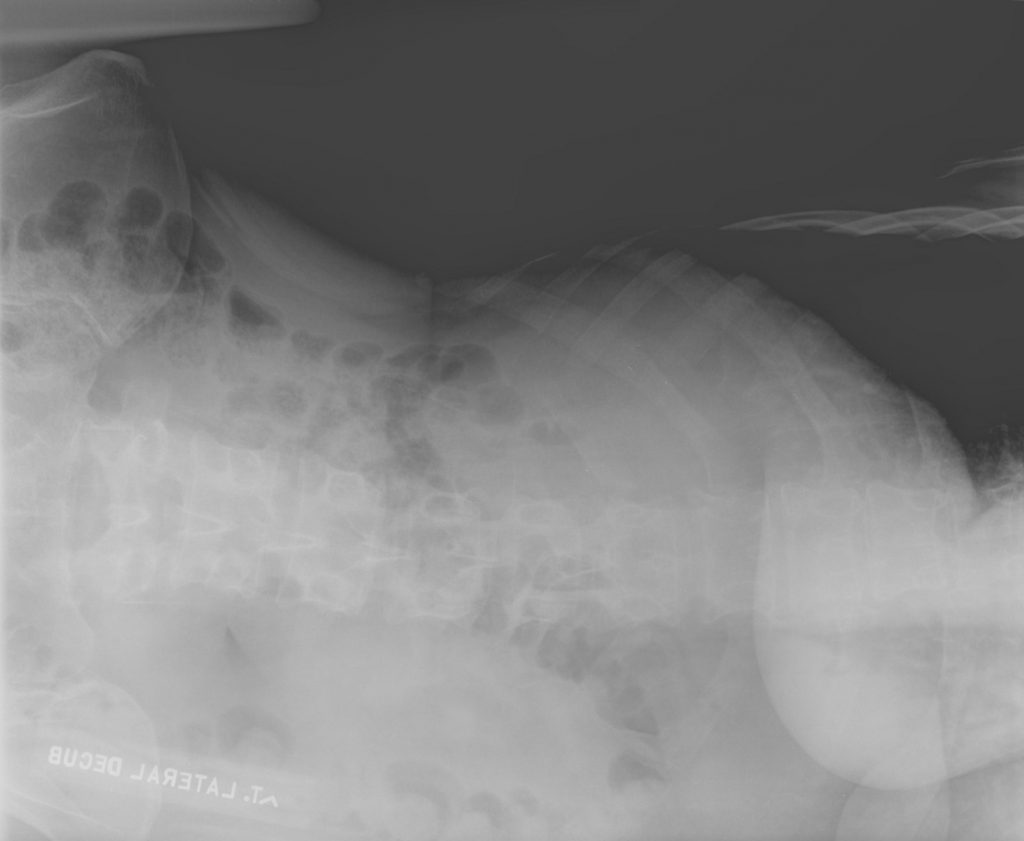
The image above demonstrates lateral skin margin burn out around the lungs (right side of image), highly suggestive of image over-exposure. However, the example above demonstrates other areas of concern. We need to be careful that poor image quality is not the result of poor patient positioning. There is a large amount of air captured on the detector (top of image) and this will alter the image histogram affecting the overall image appearance.
To maximise image quality, position the patient in the centre of the image detector and use the most appropriate exposure factors.
Radiographic contrast
Let’s get this out of the way first – radiographic contrast is independent of the amount of radiation used to generate an image. Structures with the same tissue density will have the same radiographic contrast. If a lesion transmits 5% more photons than the surrounding tissue then this holds true regardless of the x-ray quantity used.
This is why we need to give IV contrast to help improve the radiographic contrast in CT because lesions often have the exact same tissue density as the surrounding host tissue. When we see lesions on a post-contrast CT, we are seeing the IV contrast inside the lesion. This high density IV contrast, alters the physical transmission properties of that lesion and makes it stand out from the host organ.
As mentioned, the primary controlling factor for radiographic contrast is the mean photon energy (the peak voltage). High contrast imaging makes it easier to distinguish structures with similar density, e.g. the trabecular patterns on the bone or the vascular markings in the lungs.
Low energy photons are usually associated with higher radiographic contrast appearance (greater photoelectric interactions). Whereas a high energy photons are usually associated with lower radiographic contrast appearance. On a radiograph, a low contrast image is often described as ‘flat’ or ‘grey’.
Why don’t we just do everything at a low kV?
Every single thing we do is a balance of factors to achieve ALARA. The main factor in our decision of kV value is patient part thickness – thicker body parts require higher kV values for sufficient penetration power. If the kV is low, yes we will improve radiographic contrast but at the cost of insufficient penetration power.
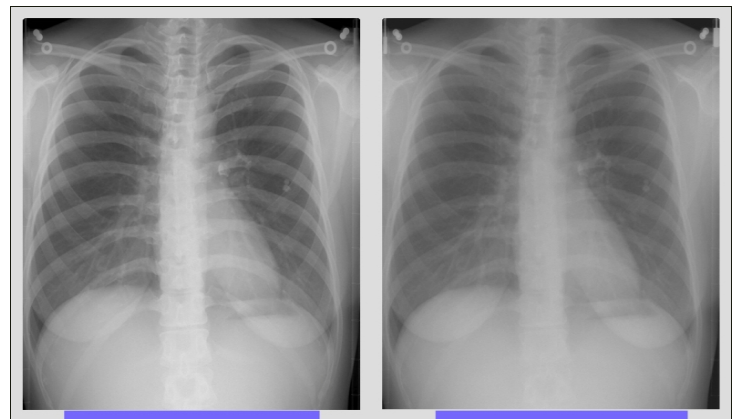
The set of images above were acquired simultaneously on a ‘dual-energy’ system but demonstrates the concept of radiographic contrast very well. On the right, the image has a flatter looking appearance when compared to the left. In more appropriate terms, you could describe the image on the right as having lower contrast when compared to the image on the left.
For the reasons mentioned in this section, can you determine why mammography often routinely uses a much lower kVp than conventional radiography?
Try the quiz on the next page.